About the stages of recruitment
Scientist Training Programme (STP) applications are processed through 4 stages of recruitment. To understand the data in context we have provided details below the graphs of what applicant data is available at each stage.
All stages of the recruitment process are implemented and managed by the School with standardisation and fairness as a top priority. The roles of shortlisters and interviewers are largely undertaken by volunteer scientists from the training departments and are supported by School staff.
The interviews were a competitive process with a ratio of 2 applicants interviewed per post; plus further reserves where necessary.
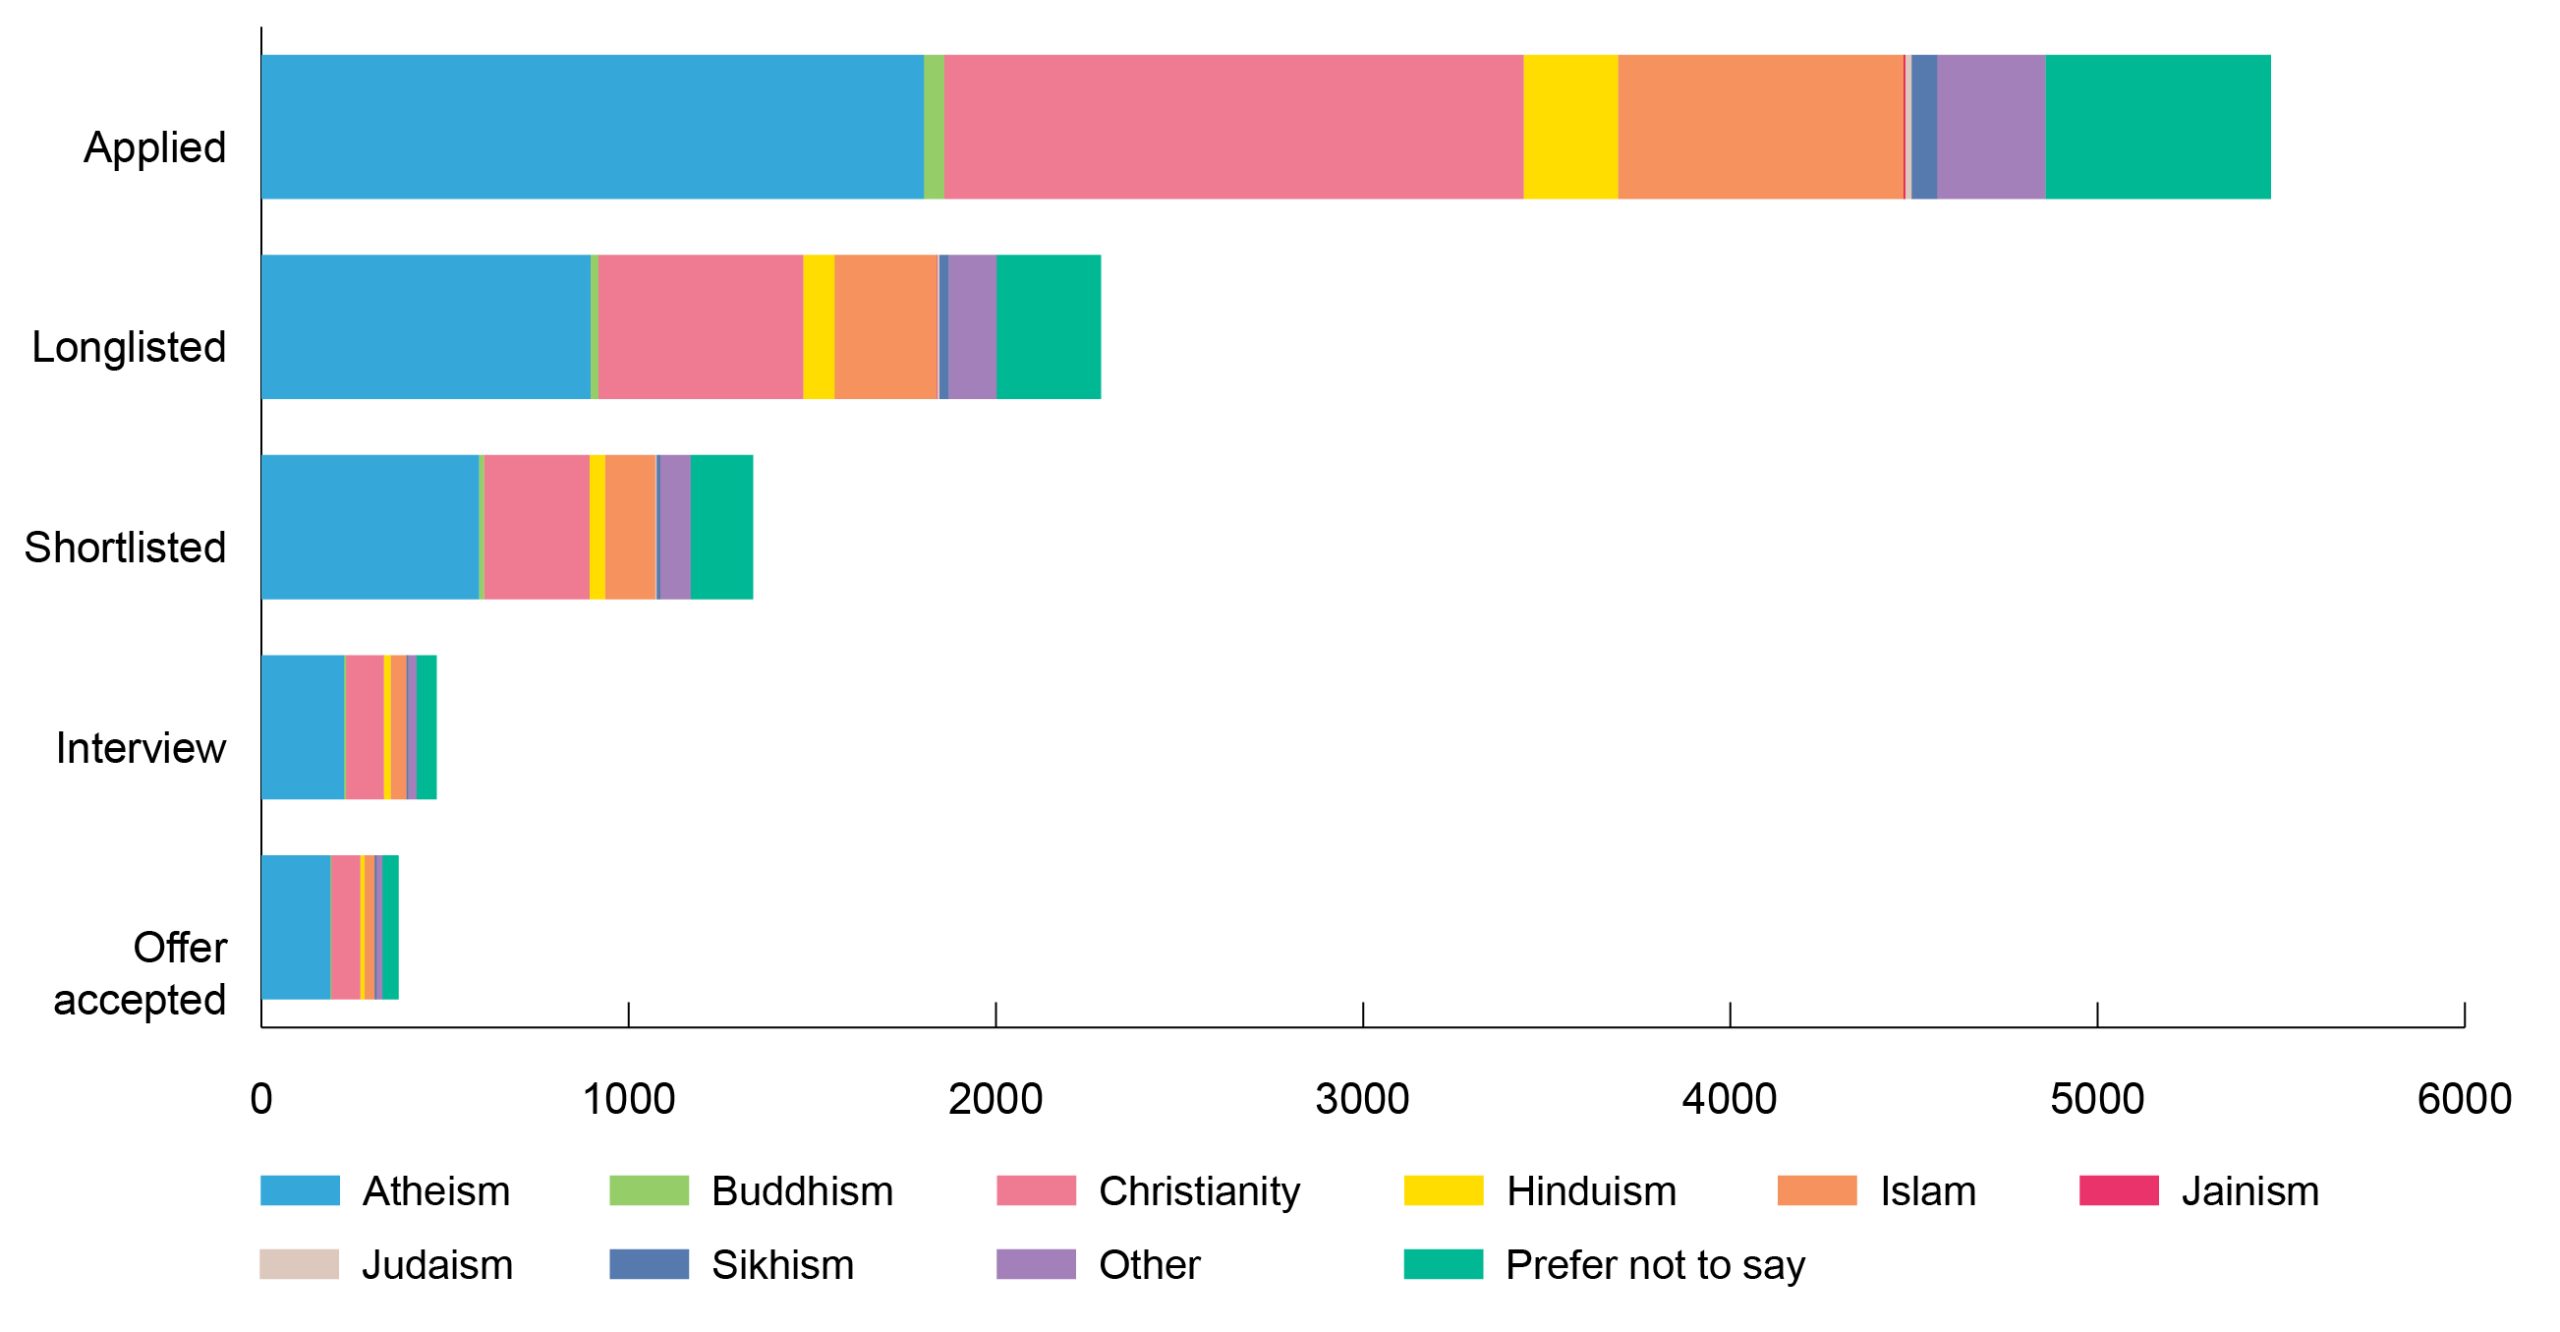
Applicants religion numbers

Graph data
| Atheism | Buddhism | Christianity | Hinduism | Islam | |
| Applied | 1804 | 55 | 1578 | 257 | 778 |
| Longlisted | 896 | 21 | 558 | 85 | 278 |
| Shortlisted | 592 | 14 | 287 | 42 | 137 |
| Interview | 225 | ≤5 | 103 | 18 | 43 |
| Offer accepted | 187 | ≤5 | 79 | 11 | 28 |
| Jainism | Judaism | Sikhism | Other | Prefer not to say | |
| Applied | ≤5 | 17 | 70 | 295 | 614 |
| Longlisted | ≤5 | 7 | 25 | 131 | 284 |
| Shortlisted | ≤5 | ≤5 | 10 | 83 | 170 |
| Interview | ≤5 | ≤5 | 6 | 22 | 55 |
| Offer accepted | ≤5 | ≤5 | ≤5 | 16 | 44 |
Applicants religion percentages

Graph data
| Atheism | Buddhism | Christianity | Hinduism | Islam | |
| Applied | 33% | ≤5% | 29% | ≤5% | 14% |
| Longlisted | 39% | ≤5% | 24% | ≤5% | 12% |
| Shortlisted | 44% | ≤5% | 21% | ≤5% | 10% |
| Interview | 47% | ≤5% | 22% | ≤5% | 9% |
| Offer accepted | 50% | ≤5% | 21% | ≤5% | 8% |
| Jainism | Judaism | Sikhism | Other | Prefer not to say | |
| Applied | ≤5% | ≤5% | ≤5% | ≤5% | 11% |
| Longlisted | ≤5% | ≤5% | ≤5% | 6% | 12% |
| Shortlisted | ≤5% | ≤5% | ≤5% | 6% | 13% |
| Interview | ≤5% | ≤5% | ≤5% | ≤5% | 12% |
| Offer accepted | ≤5% | ≤5% | ≤5% | ≤5% | 12% |
Access to earlier data
Data prior to 2021 can be found in the publications section by using the ‘content type’ filter and selecting ‘data’.